Streetcar systems: which ones are good transit?
[ezcol_2third id=”” class=”” style=””]
We’re in the midst of a streetcar boom in the United States. In city after city, political leaders are promoting new streetcar lines.
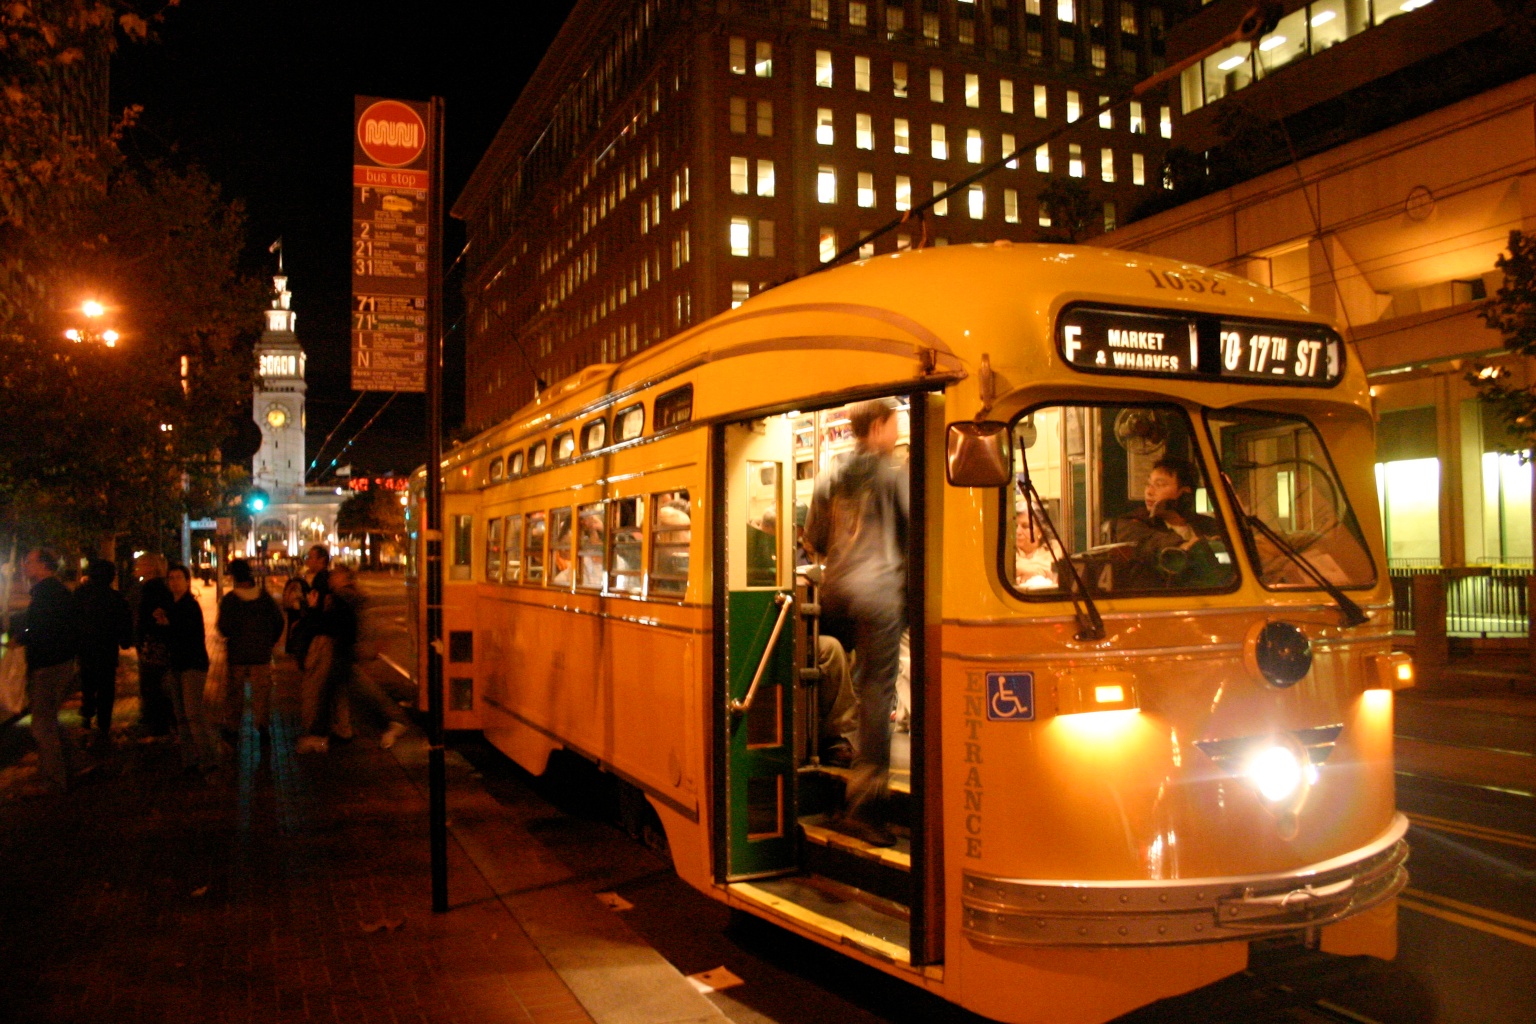
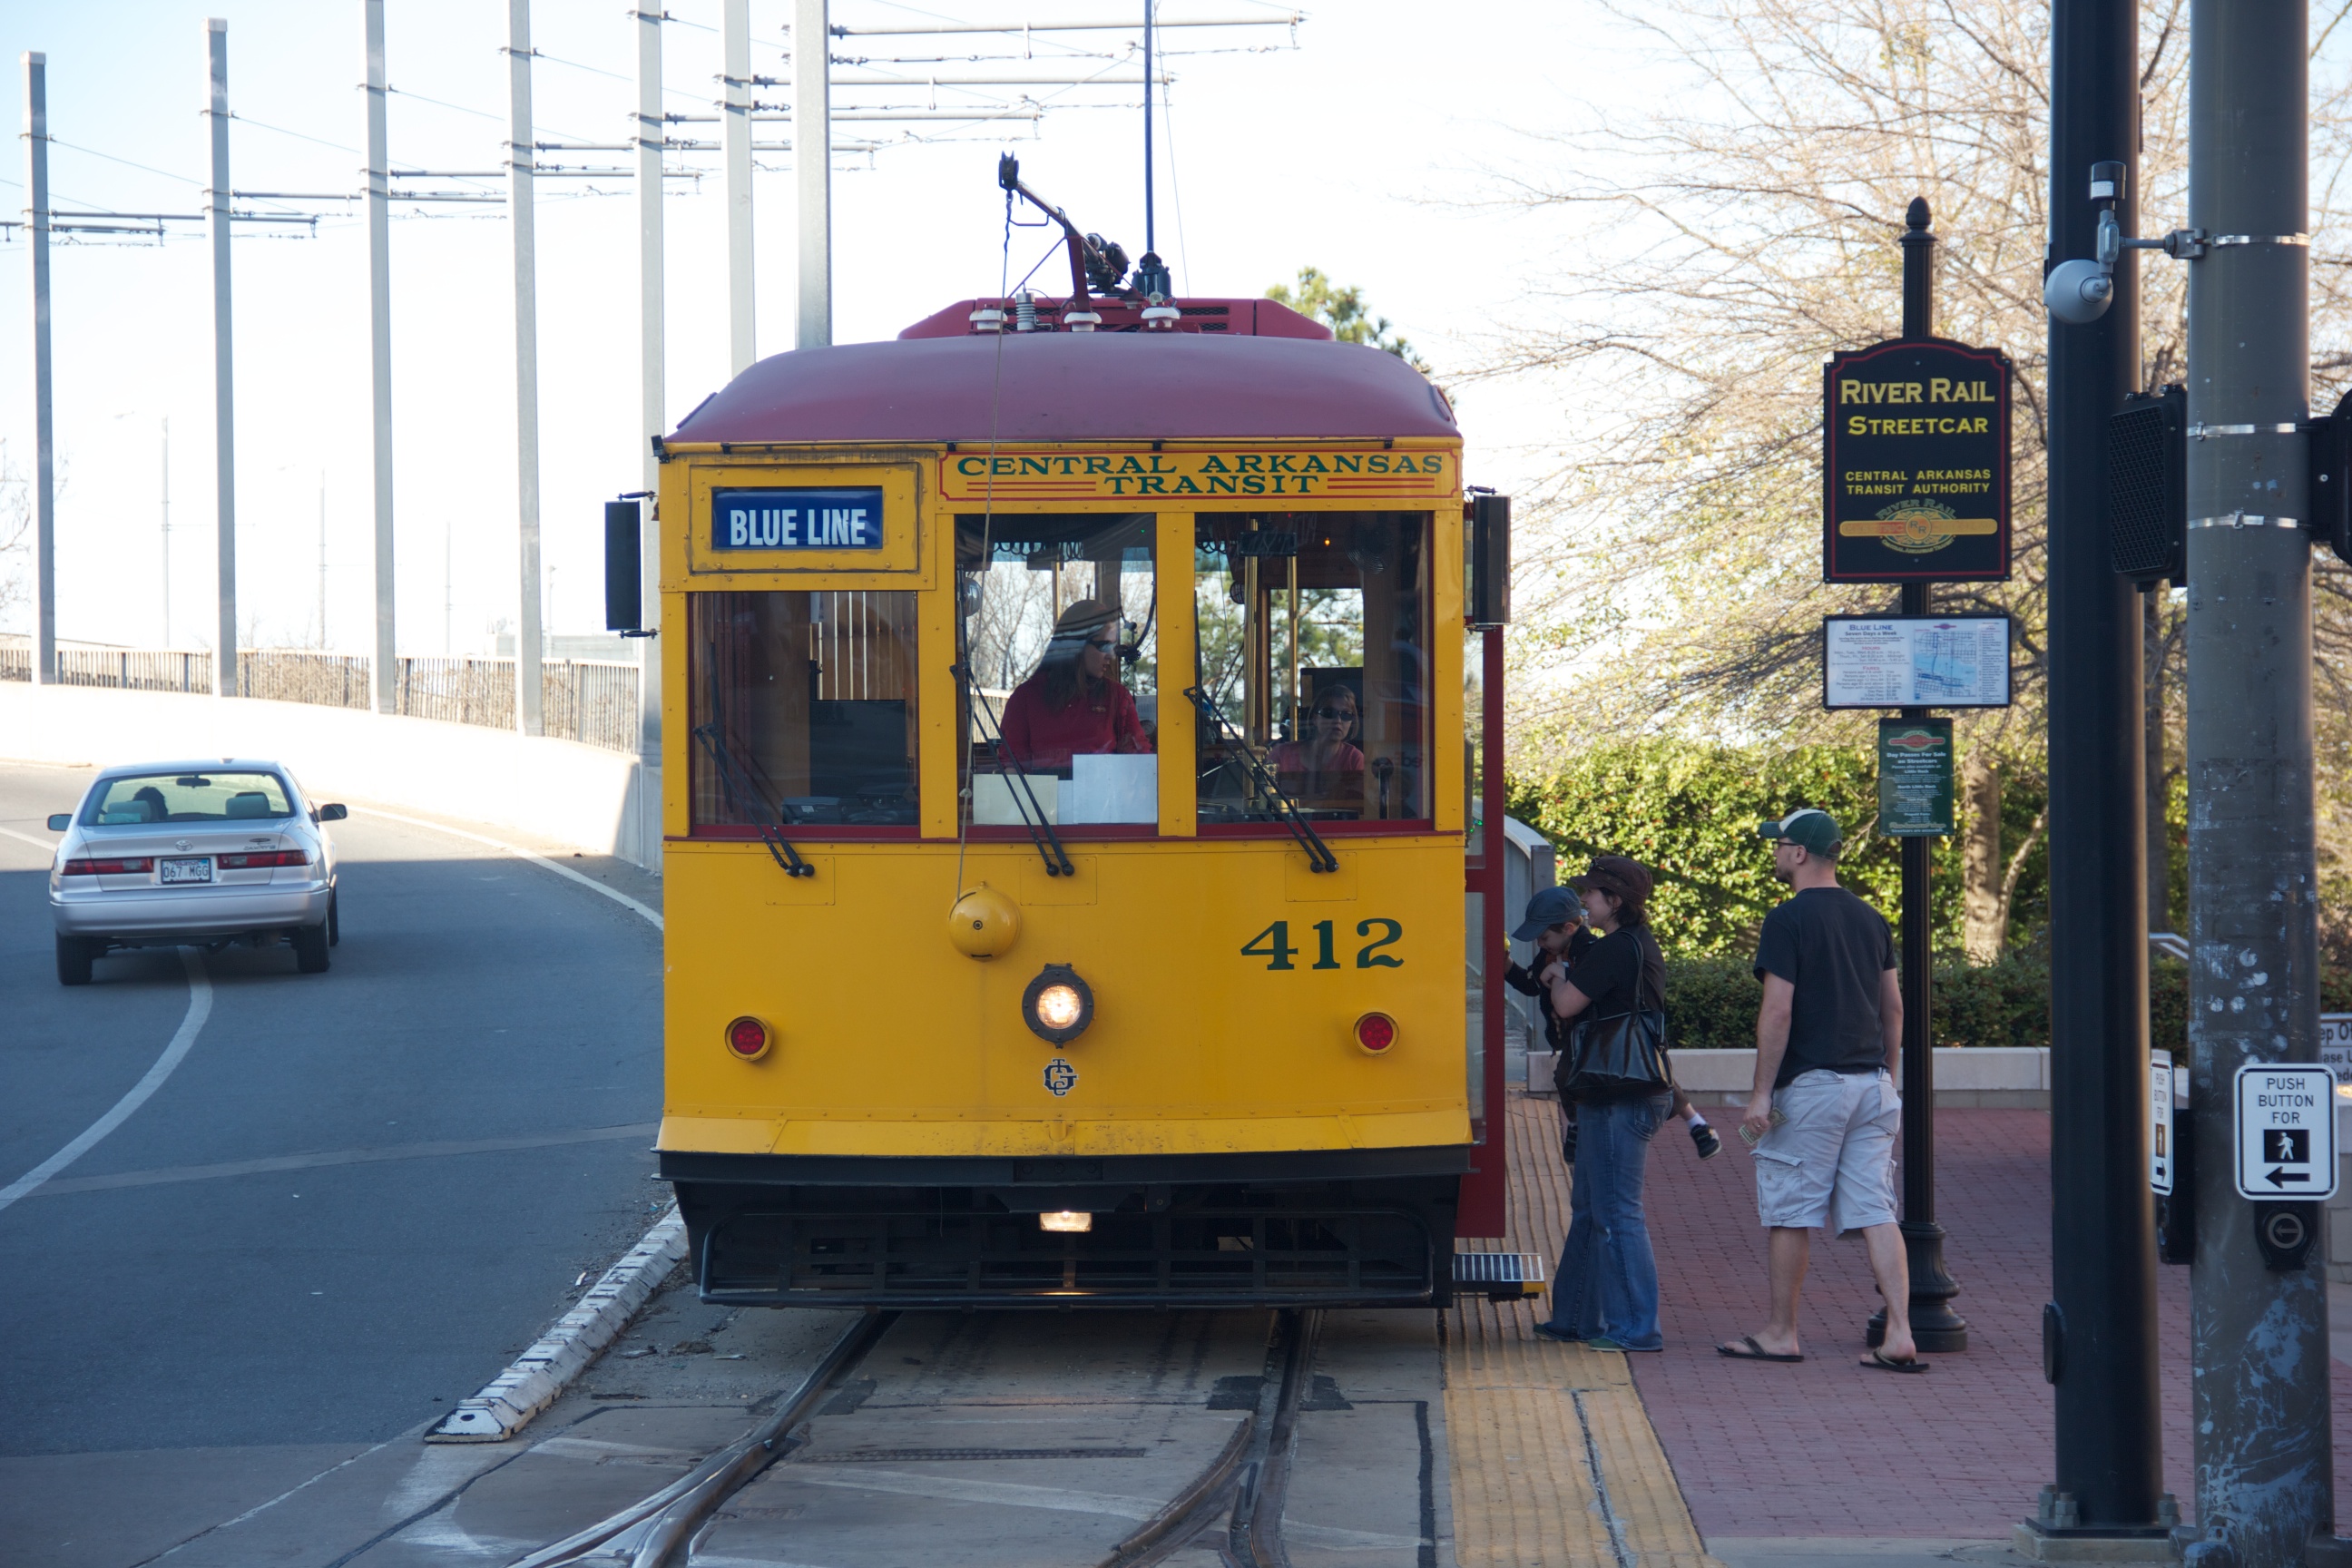
But not all streetcars are created equal. The systems that are already operating, under construction, or in design vary dramatically in how effective they are: San Francisco carries over 3,000 passengers for every mile of route, but Little Rock carries only 100. What makes the difference? Destinations and service. The successful systems run frequently all day, connect a variety of destinations, including employment, residential areas, and leisure destinations, and integrate into a larger transit system. The least successful have infrequent service, limited hours, serve mainly leisure destinations, and were planned as standalone lines. Cities tend to fixate on the visible aspects of streetcars (like the question of vintage vehicles vs. modern ones), but what really matters is the same thing that matters for all transit: does the streetcar go where a lot of people want to go when they want to go, and does it get them there conveniently?
Here’s a comparison of all active US streetcar lines as well as a number of lines under construction or planning. Information is from a variety of sources as of October 2013.
(updated Nov 2013)
[/ezcol_2third] [ezcol_1third_end id=”” class=”” style=””]

Streetcars in San Francisco (top) and Little Rock (bottom): They look a lot alike, but one as 30 times as effective as the other. Why?
[/ezcol_1third_end]
Comments are Disabled